Expert Summary
In a Minecraft server, multiple issues can cause lag, ranging from things like entities, CPU, memory, garbage collection, and more. The process of simply allocating more memory or storage is not enough, as it won't solve the problem.

Make your own FREE minecraft server
MINECRAFT FREE SERVER
Now you can use Spark to find the issue causing lag on your server with the help of its profiling tool. The tool generates a detailed profile of your server, including multiple performance factors and graphs based on its data. Now the key to finding the issue is to go through the nodes of the thread tree in the profile report to view the task/function that is taking the most processing and get to it.
Also, remember to prefer MSPT (milliseconds per tick) over TPS (ticks per second) when checking the server's performance, as TPS can be manipulated by TPS limiters present on server types like bukkit, paper, and more.
In simple terms, all the issues causing lag on your server are solvable only if you know what is causing them. So, locate, review, and fix them accordingly.
Lag is annoying, and the thing that makes it more annoying is the fact that it is caused by multiple underlying reasons you don't even know about. Now imagine increasing your server RAM or storage to reduce lag, but at the end of the day players still experience it due to entity cramming or some other issue.
Now, to counter that, a performance profiling tool named Spark comes into the picture. Based on that, this guide will be all about understanding, using, and troubleshooting lag on your Minecraft server with the help of Spark so you don't have to wait in long queues for support.
What is Spark?
Spark is an advanced diagnostic tool that can be used for your server's profiling, memory inspection, and health reporting. In short, you can easily find the reasons for lag on your Minecraft server that is either caused by CPU/storage, entity cramming, plugins/mods, or other underlying reasons. It works by measuring TPS (ticks per second), CPU/RAM usage, and more to generate a report of your server.
Understanding TPS (ticks per second) and MSPT (milliseconds per tick)
Before getting into Spark, we have to get familiar with TPS and MSPT. Below include their working, concept, and differences.
- TPS (ticks per second): A server calculates in-game time in ticks. Meaning in-game tasks like mob movements, plant growth, day/night cycle, and more depend on ticks, and a server generates a tick every 50 milliseconds or 0.05 seconds, making it a total of 20 ticks in a second. Now a server running on 20 ticks/second or 18 ticks/second will run smoothly, but on the other hand, a server clocking 15 to 10 ticks/second will have a considerable amount of lag due to a delay in the processing of multiple cycles, entities, and machines.
- MSPT (milliseconds per tick): Similar to ticks per second, MSPT stands for milliseconds per tick and is the total time your server takes to complete a single tick. Since a normal
server aims to generate a tick in 50 milliseconds (1 second = 1000 milliseconds / 20 ticks), this means a server having MSPT any higher than 50 will start experiencing lag.
- Difference: When checking for lag, always prefer MSPT over TPS. Why?! Because server types like Bukkit, Spigot, and Paper include a TPS limiter that works by slowing server processes to prevent them from crashing, ultimately showing a perfect 20/20 TPS while actually running on 10 to 15 TPS.
Now, MSPT, on the other hand, only shows the total time your server takes to generate a single tick, i.e., 50 MSPT. So, if your server ever shows a perfect 20/20 TPS while having an MSPT of anything above 50, then something needs fixing.
Generating a Profiler Report with Spark
Now that you are done understanding the basic terminologies and concepts, you can generate your server's profile using Spark profiler. Now, it basically gives you an overview of your server's performance that's viewable on a web interface. To start it, run the below-mentioned command on your server.
/spark profiler start
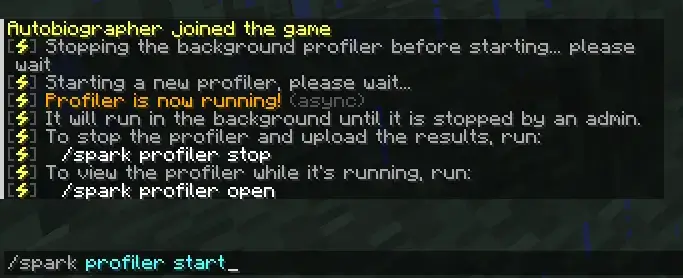
Now allow the profiler to run for a few minutes. The more time you let the profiler run, the more accurate and detailed a report will be generated. Now shortly after that, you can close the profiler, and a unique link to your server's report will be generated. To do that, run the below-mentioned command.
/spark profiler stop

Understanding Spark Profiler Report
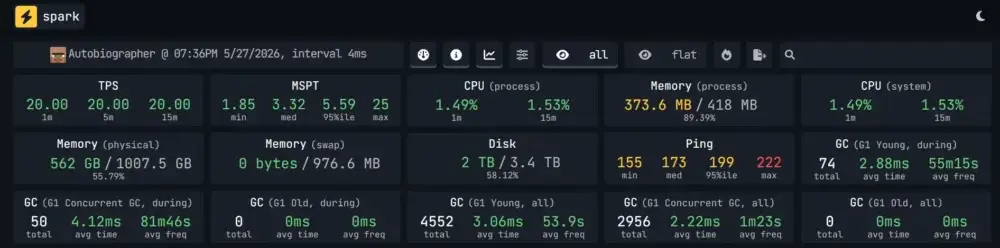
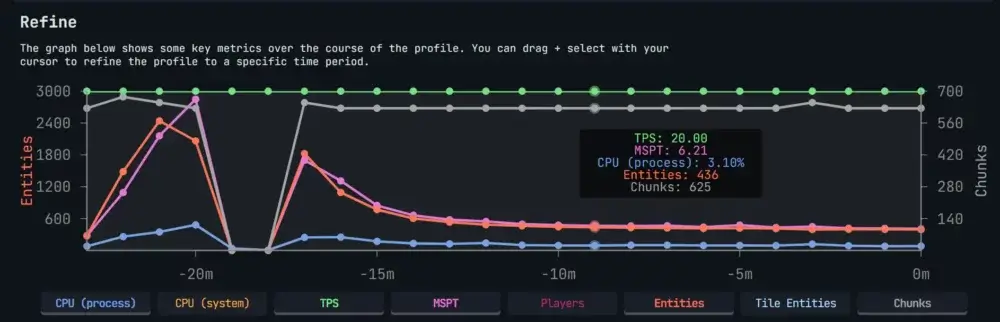
Okay! Now that you have successfully generated the report, you can now start finding issues that are causing lag on your server. To start, the first section includes a metrics panel that showcases different performance indicators like TPS, MSPT, CPU, disk, and more.
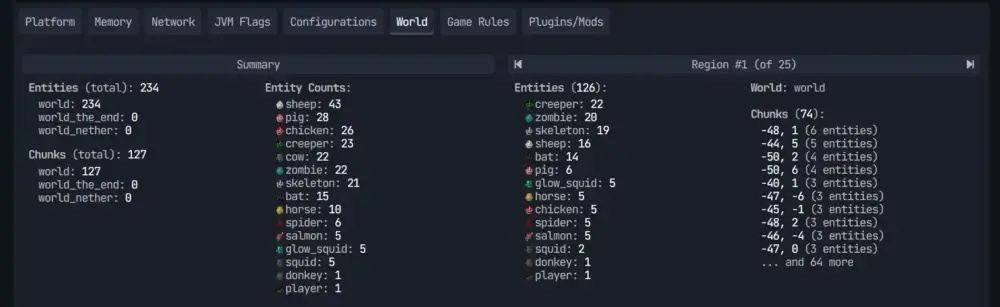
Next you will encounter the information panel that will allow you to view different information and configurations of your server ranging from entity data, plugins/mods, game rules, and more.
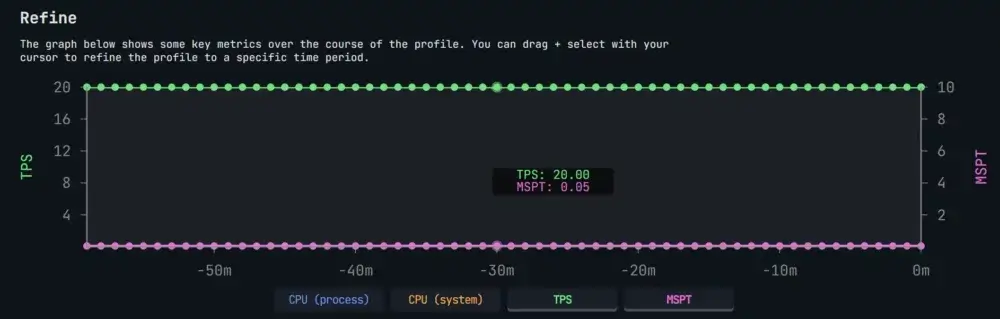
Next you will find a graph that will show you different metrics of your server in fixed intervals that happened during the profiling session. Due to this, we again advise you to leave the profiler running for at least 10 to 20 minutes to get detailed results.
Finally, you will encounter the "All View" section, which will showcase you all the processed threads. Now, a thread is a function that is performing multiple tasks on your server through nodes present in it. In the case of Minecraft servers, only a single thread named "Server Thread" is responsible for running the game.
Also, to mention, this section is mostly used to identify the factors causing lag on your server.

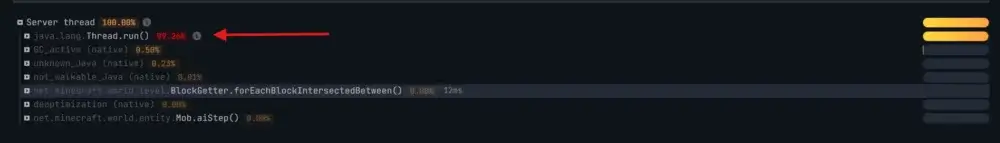
To get started, we will start the issue identification process by opening the thread, and, in our case, only the node java.lang.Thread.run() contains more than 99% of the processing.
So we will open it further to find out the node that is taking the most processing along with its function with the help of the info point symbol present next to them. Like in the below picture, the MinecraftServer.runServer() is responsible for the tick function along with the server's startup/shutdown.
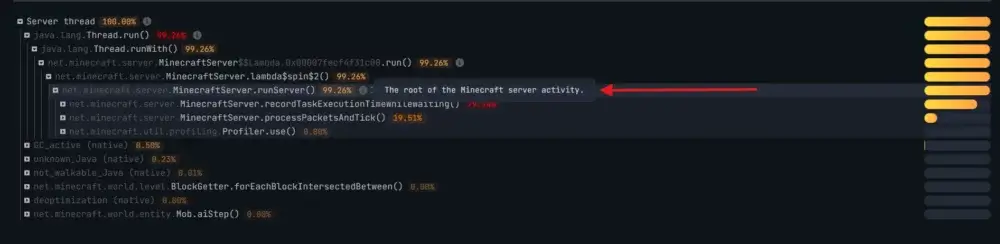
Continuing forward, you will now have to keep expanding the tree to locate the node that is taking the most processing to ultimately find the root cause of lag on your server. Now remember to always view the info symbols to understand the function of the node you are at. You can also check out the official wiki explaining this at Spark
Garbage Collector and Memory Issues
The garbage collector is responsible for automatically cleaning all the data that is no longer accessible or needed by your server. In simple terms, Minecraft servers generate temporary data like item drops, entity calculations, and more. This data is stored in the memory of the server till the garbage collector wipes it.
When the wipe occurs, the entire server needs to be stopped. Now the time required can range anywhere from a few milliseconds to multiple seconds, depending upon your server's memory and the total amount of data to be cleaned. Hence, multiple pauses due to garbage collectors can cause lag.
Now this is caused by reasons like low memory (RAM), memory leaks, rapid data generation, and more. To fix this, view your GC_active (native) node in the "Server Thread" tree.
And if you want to make sure how much
RAM do you need - you can use
our tool to know exactly how much
RAM do you need for a specific modpack server.
Anything over 5% is concerning and requires you to increase your server memory.
Similarly, also check for memory leaks that happen when the server generates data but never deletes it. It happens due to reasons like plugin/mod conflicts, entities not despawning, and more. As a result, your server memory usage keeps climbing until it crashes.
Steps to Detect Lag on your Minecraft Server
After reading everything, below are the steps to take when facing lag on your server.
- Start by installing Spark on your server and starting a profiling session for a few minutes to generate a detailed web-based report on your server.
- Next, check the MSPT (milliseconds per tick); if it is above 50 MSPT, then minor lag can occur, but anything in the range of 80 to 120 can cause major lag on your server.
Ultimately making it unplayable.
- Further check the call tree root level and find out which category used the most processing. The categories include plugins/mods, ticking blocks (red stones, plants, etc.), entities, world generation, or others.
- On finding the category, try to implement appropriate changes to reduce their load accordingly.
- On implementing changes, run the profiler again. If the MSPT and other performance factors have improved, then your problem is solved; otherwise, there is a chance that you may have multiple sources of lag.
Resources
Below include the links to the resources Spark has published. We suggest you give them a visit.
Conclusion
Have you tried everything in the guide and are still facing issues?! Then don't worry, we are here to help. Just create a ticket or mail us at support@godlike.host along with a link to your server's profile using Spark. This will make it easier for us to know the problem your server is facing and resolve your issue accordingly.


 en
en